Click here for iFriendly audio.
The City has a new feature on its website. Viewers can now see real-time information about Wrangell’s electrical system.
Clay Hammer is the superintendent of Wrangell Municipal Light & Power.
He says this tool will give the community a chance to keep track of the city’s electricity.
“It just kind of gets you an insider’s view of what’s happening with the Wrangell distribution system,” says Hammer.
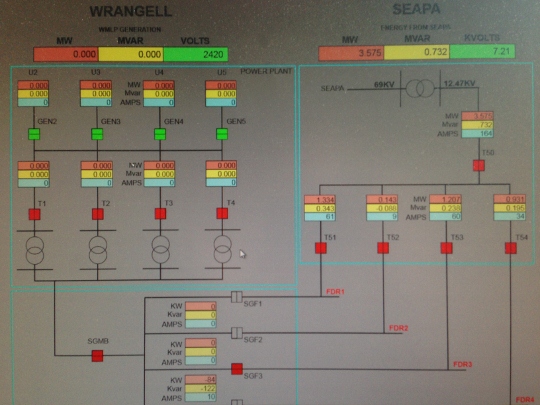
On the webpage, the diagram is divided in half. The left side shows the city’s diesel plant.
“We have our four generators listed there. When we are generating diesel power, you can look online and see how much power we’re generating, with which generator, and that kind of information,” says Hammer.
The right side represents the Tyee hydroelectric project, run by the Southeast Alaska Power Agency.
“Basically it tells you what we’re importing from SEAPA,” says Hammer.
The two sides together make up all of Wrangell’s power—what the city’s diesel generators put out and what the city brings in from hydro.
On the lower half of the page, there are four lines marked FDR1, 2, 3, and 4. Those stand for feeders one through four.
The feeders provide power to different parts of the city.
“If you know which feeder you’re on—and you can call us and we’ll certainly fill you in and let you know which feeder you’re on—you can look at this and you can tell what that particular section of town is doing load-wise,” says Hammer.
Here’s a quick breakdown:
Feeder 1 covers Case Avenue from the Power Plant to Shakes Street, Church Street to the Ferry Terminal, continuing on the airport loop to the Forest Service building. It also covers all of downtown except during the winter months.
In winter, Feeder 2 covers downtown along with its normal area of Shakes Street from Rayme’s Bar to Reliance Harbor.
Feeder 3 goes from the corner of Case and Zimovia to the Public Safety Building and then up Bennett to the Forest Service.
Feeder 4 starts at the corner of Case and Zimovia and goes all the way out the road to 13 mile. It also covers Peninsula to the point.
Hammer says the online tool is interesting because it shows people how they are connected to this complex system of power.
“It’s unlikely you would notice the difference if you were to run around and shut off all the lights. You probably wouldn’t be able to change the meter much, but it’s interesting just to know what you’re doing is part of that feeder,” says Hammer.
He says this is a useful tool during power outages, too.
“Another way that this would be handy is for instance, if the lights went out and you were kind of curious, you could go look and see which portions of town are out. You could see whether it’s simply a feeder outage or, if you see green lights across the board, you would know the whole system is down. More importantly, if the megawatt hours read zero, you know we really have a problem,” says Hammer.
Community members can only view the webpage.
But, Hammer says, the people who work on the system can actually tap into it via this tool. That makes it easier to fix problems and share information at a distance.
He says it should make repairs more efficient.
And, he says, it’s just a great way of involving the community in the system that allows everyone to flip a switch and turn on the lights.


